# Bug Statistics
In project collaboration, you can view the bug statistics of all issues.
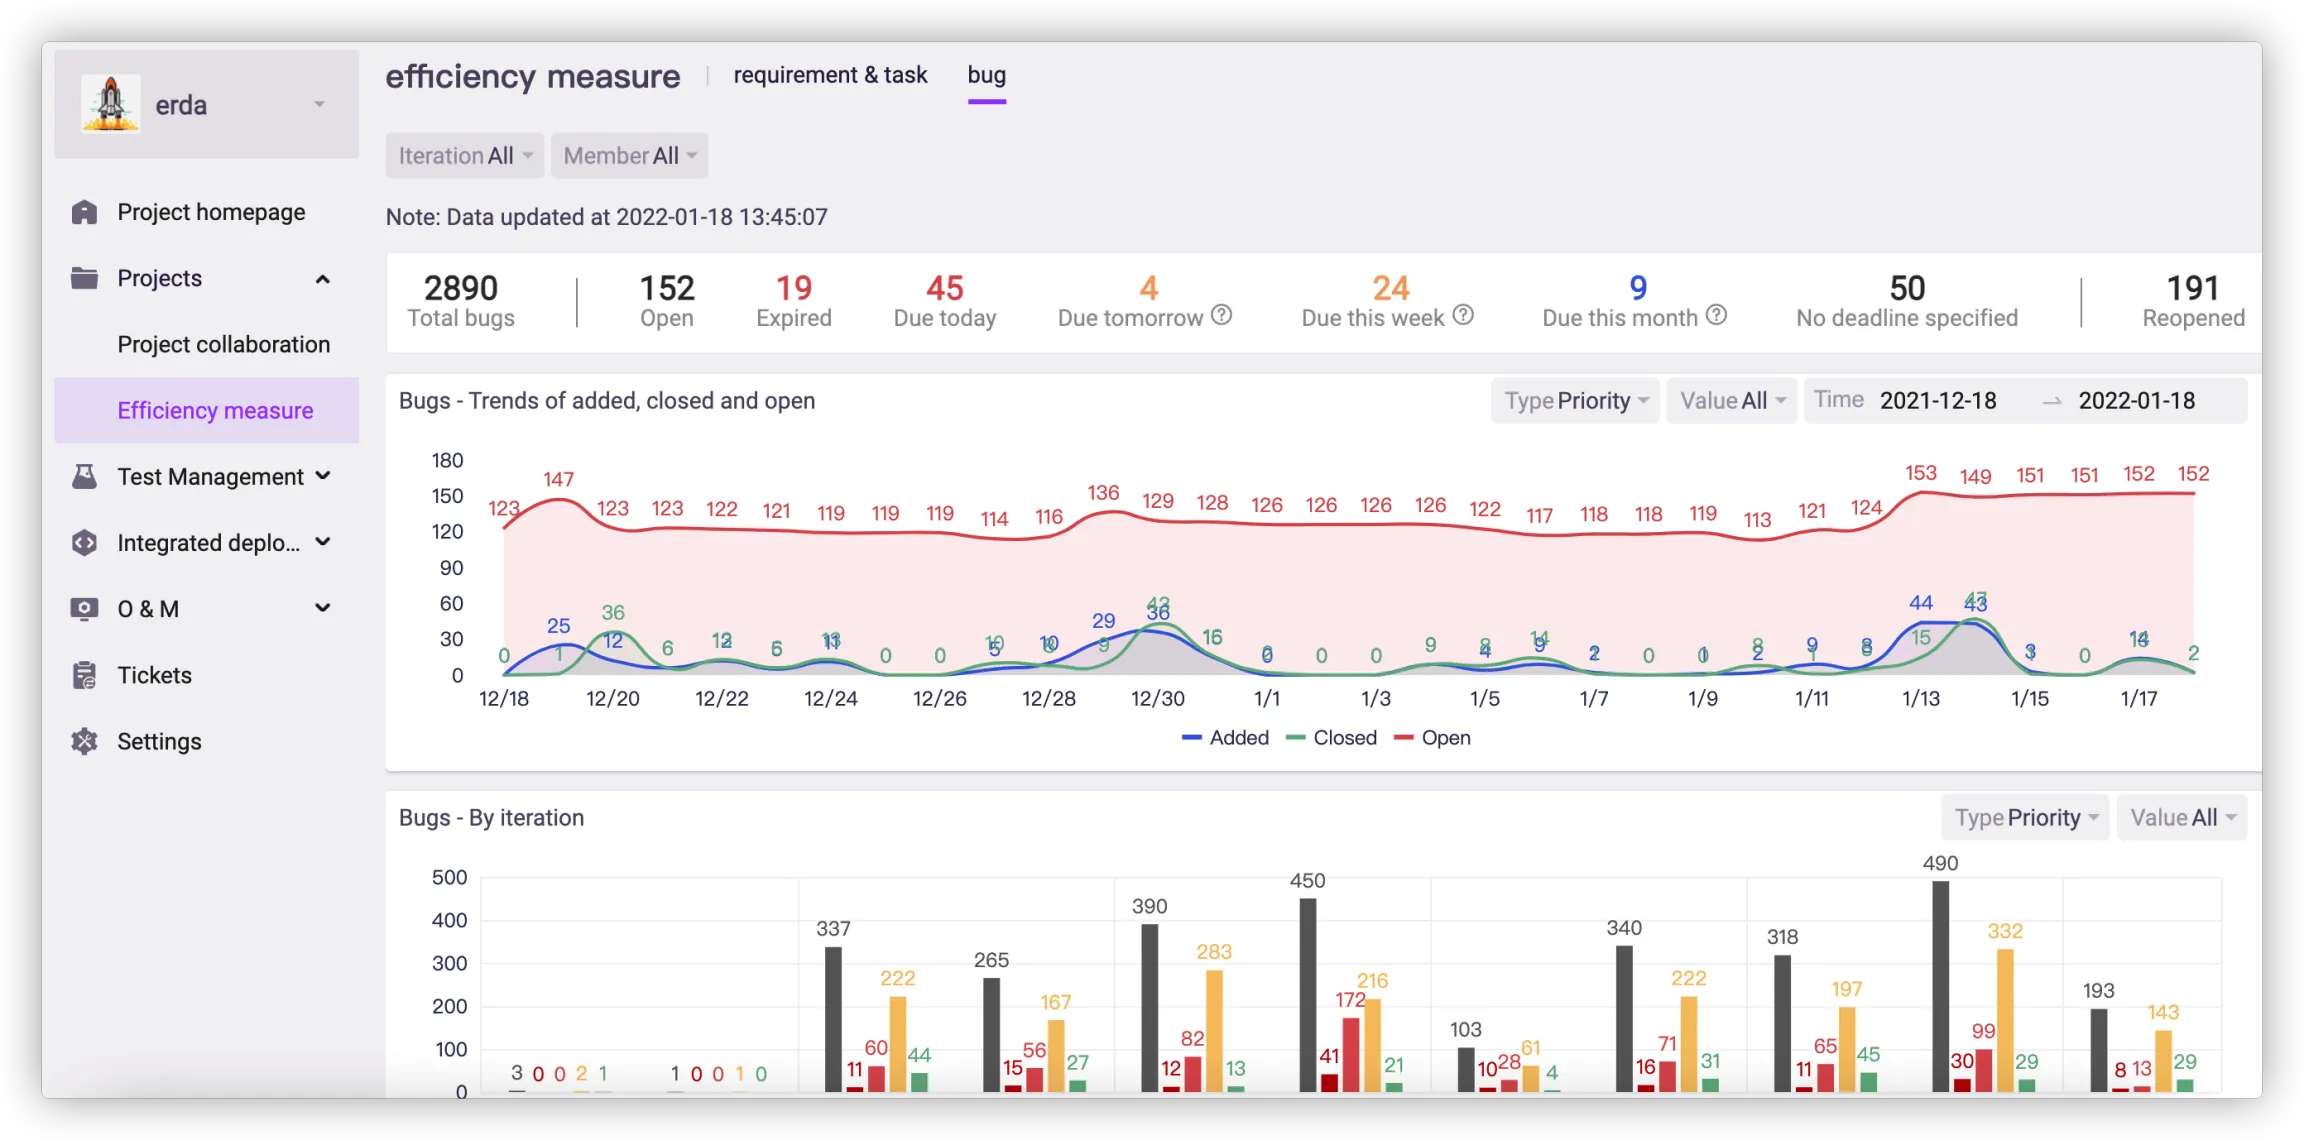
Go to DevOps Platform > Projects > Efficiency Measure > Bug, and select one or more iterations, or select members (the default is all iterations and all members), and the exact time of the statistics will be prompted below.

In the statistics results, you can view the bug statistics under the filter conditions, including the total number of bugs, open, expired, due today, due tomorrow, due this week, due this month, due date unspecified and reopened (the number of times the bug is reopened).
# Trend Chart
Three curves with different colors represent the trends of newly added, closed and open bugs. Click the text description to hide or show the corresponding bug curve. The default time of the x-axis is the last month, and you can filter bugs based on priority, complexity, severity, and time interval in the upper right corner.

# Bar Chart
Bugs distributed by iteration/state
When multiple iterations are selected, the chart will display the data of the selected iterations in order based on the filter conditions (priority, complexity, severity, state, and source).

Bugs distributed by label/assignee of unclosed bugs (Top 500), etc.
The horizontal bars represent the number of bugs, and different colors correspond to various filter conditions in the upper right corner.

# Pie Chart
The charts show the percentage of bugs in different states separately.

# Scatter Chart
The dots on the chart represent bugs and the two axes refer to the average resolved and response time respectively. It also supports bug filtering based on types.

← Bug Gantt Chart →
