# Kubernetes Dashboard
# Cluster List
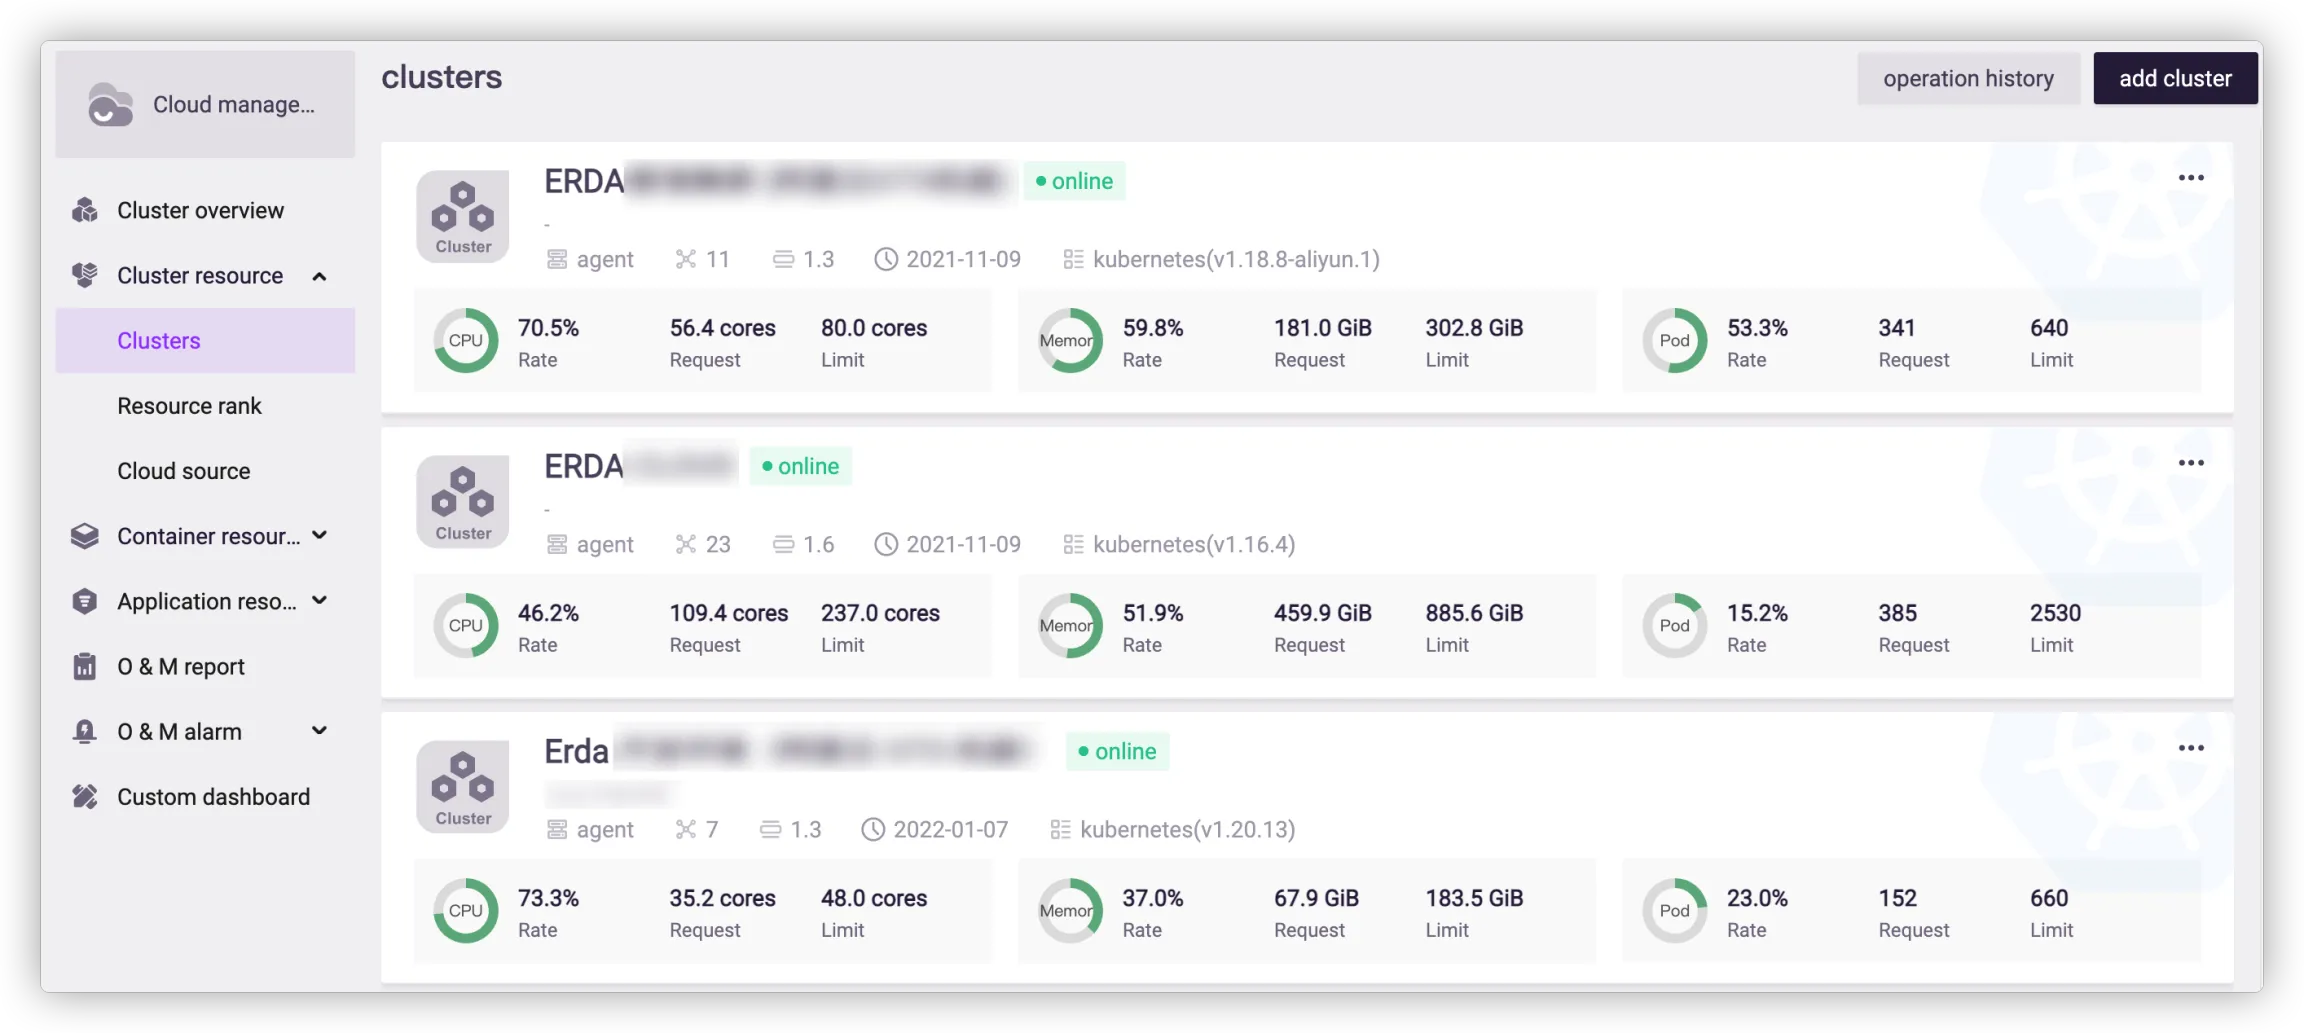
Go to Cloud Management > Cluster Resource > Clusters to view the cluster list. The information of all clusters in the organization are displayed such as name, status, description, type, management method, version and number of machines.
Click a cluster to enter its detail page.
# Container Resource
Go to Cloud Management > Container Resource. It shows information such as nodes, pods, workloads and event logs of clusters, and provides the kubectl command line tool with audit features.
# Kubectl Command
Click Kubectl Command in the upper right corner to open its interface, where to run kubectl commands to interact with API server of the cluster.
All operations will be recorded as audit log, that can be viewed in Org Center > Audit Log.
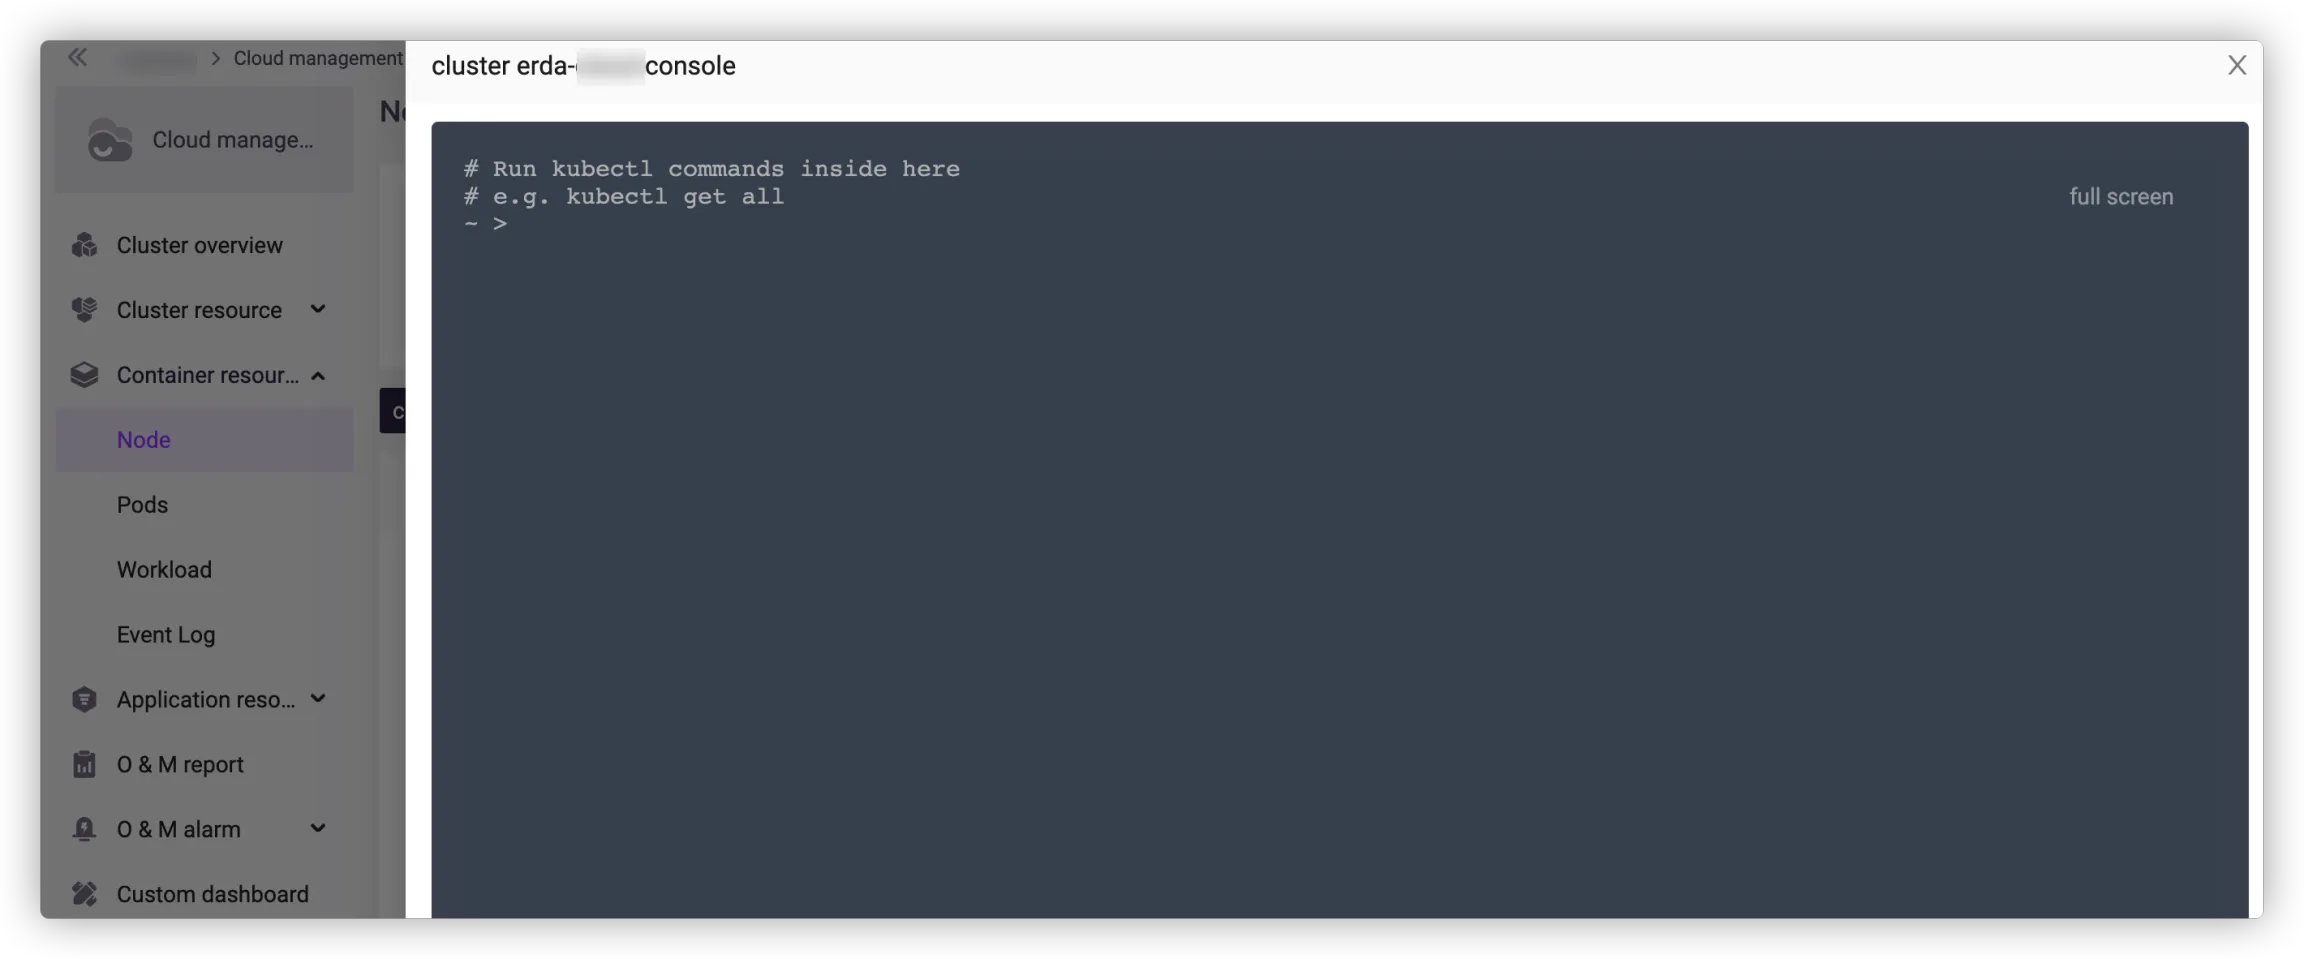
For more information on kubectl, see Overview of kubectl (opens new window).
# Node List
This page shows the allocation and usage of all nodes in the cluster. For more information on Kubernetes nodes, see Nodes (opens new window).
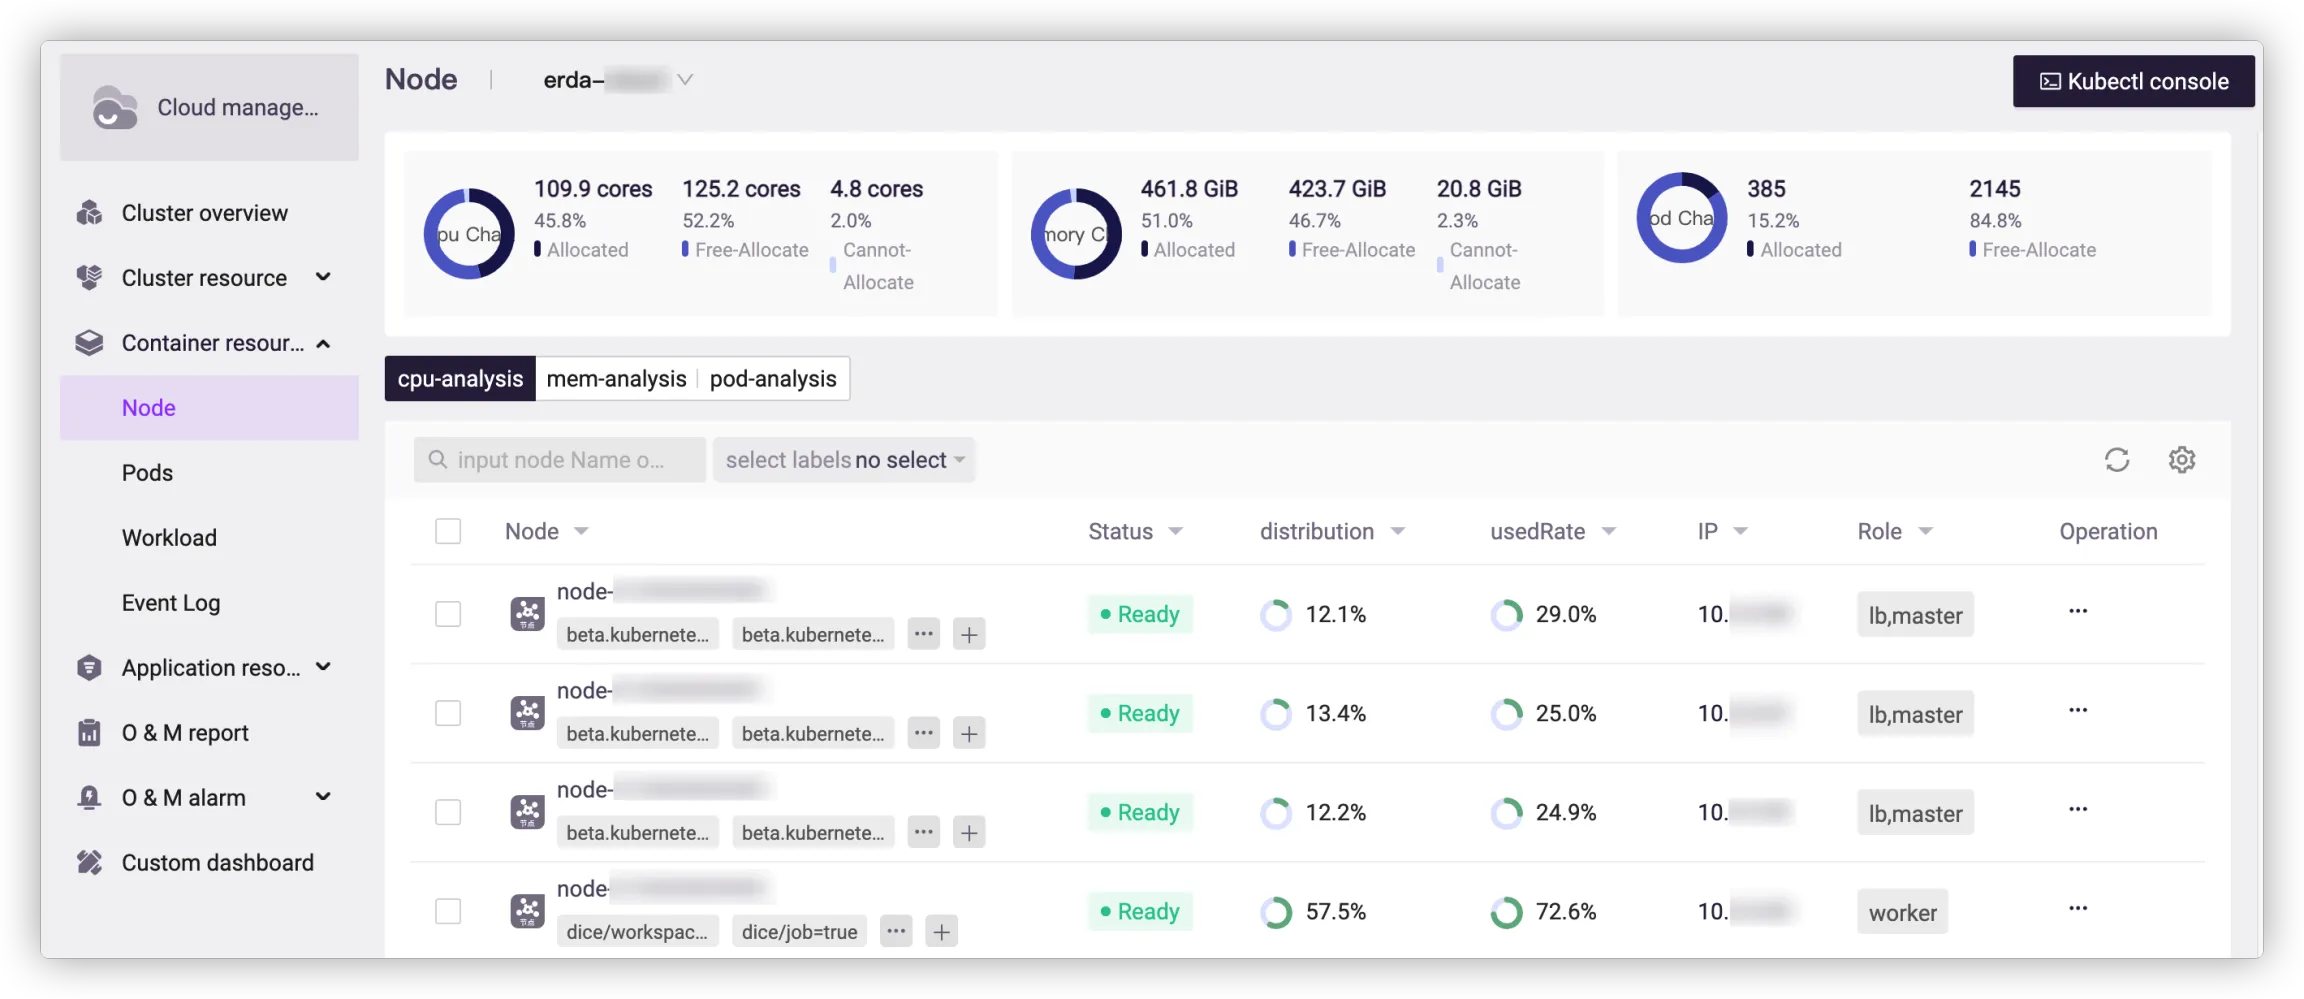
You can filter nodes by label, node name or IP.
The node label refers to the key-value pair attached to the node, to identify the attributes with specific meaning to the manager. The key of any label on the node is unique. The platform provides organization labels (to identify the organization to which the node belongs), environment labels (to identify the environment in which the node is applied), service labels (to identify the service used by the node) and job labels (to identify the job task). Besides, you can also select labels in Other Label if necessary.
Enter the node name or IP to search for the node accurately.
For more information on Kubernetes labels, see Labels and Selectors (opens new window).
# Resource Allocation Analysis
- Allocated in CPU graph indicates the amount and percentage of CPU requested by the selected nodes, and Free-Allocate refers to the remaining part.
- Allocated in memory graph indicates the amount and percentage of memory requested by the selected nodes, and Free-Allocate refers to the remaining part.
- Allocated in pod graph indicates the number and percentage of pods scheduled to the selected nodes, and Free-Allocate refers to the remaining part.
# Resource Usage Analysis
The list of resource usage analysis shows the allocation and usage of CPU, memory and pods, with information such as node name, node status, resources of allocated and used, node IP and role.
- Formula for distribution of CPU and memory: Distribution = The amount of resources requested by the node / The total amount of resources
- Formula for used rate: Used rate = The amount of resources used by the node / The total amount of resources
- Formula for distribution rate: Distribution rate = The amount of resources used by the node / The amount of resources requested by the node
- Formula for usage of pod: Usage = The number of pods scheduled to the node / The number of nodes schedulable
In the column of Node, you can add or delete labels for the node, or go to the node detail page by clicking the node name.
In the column of Operation, you can click Show to go to the pod list page and view information of all pods on the node, which is equal to filtering pods by node name on the pod list page.
# Node Details
You can view the node status, node information and machine information here.
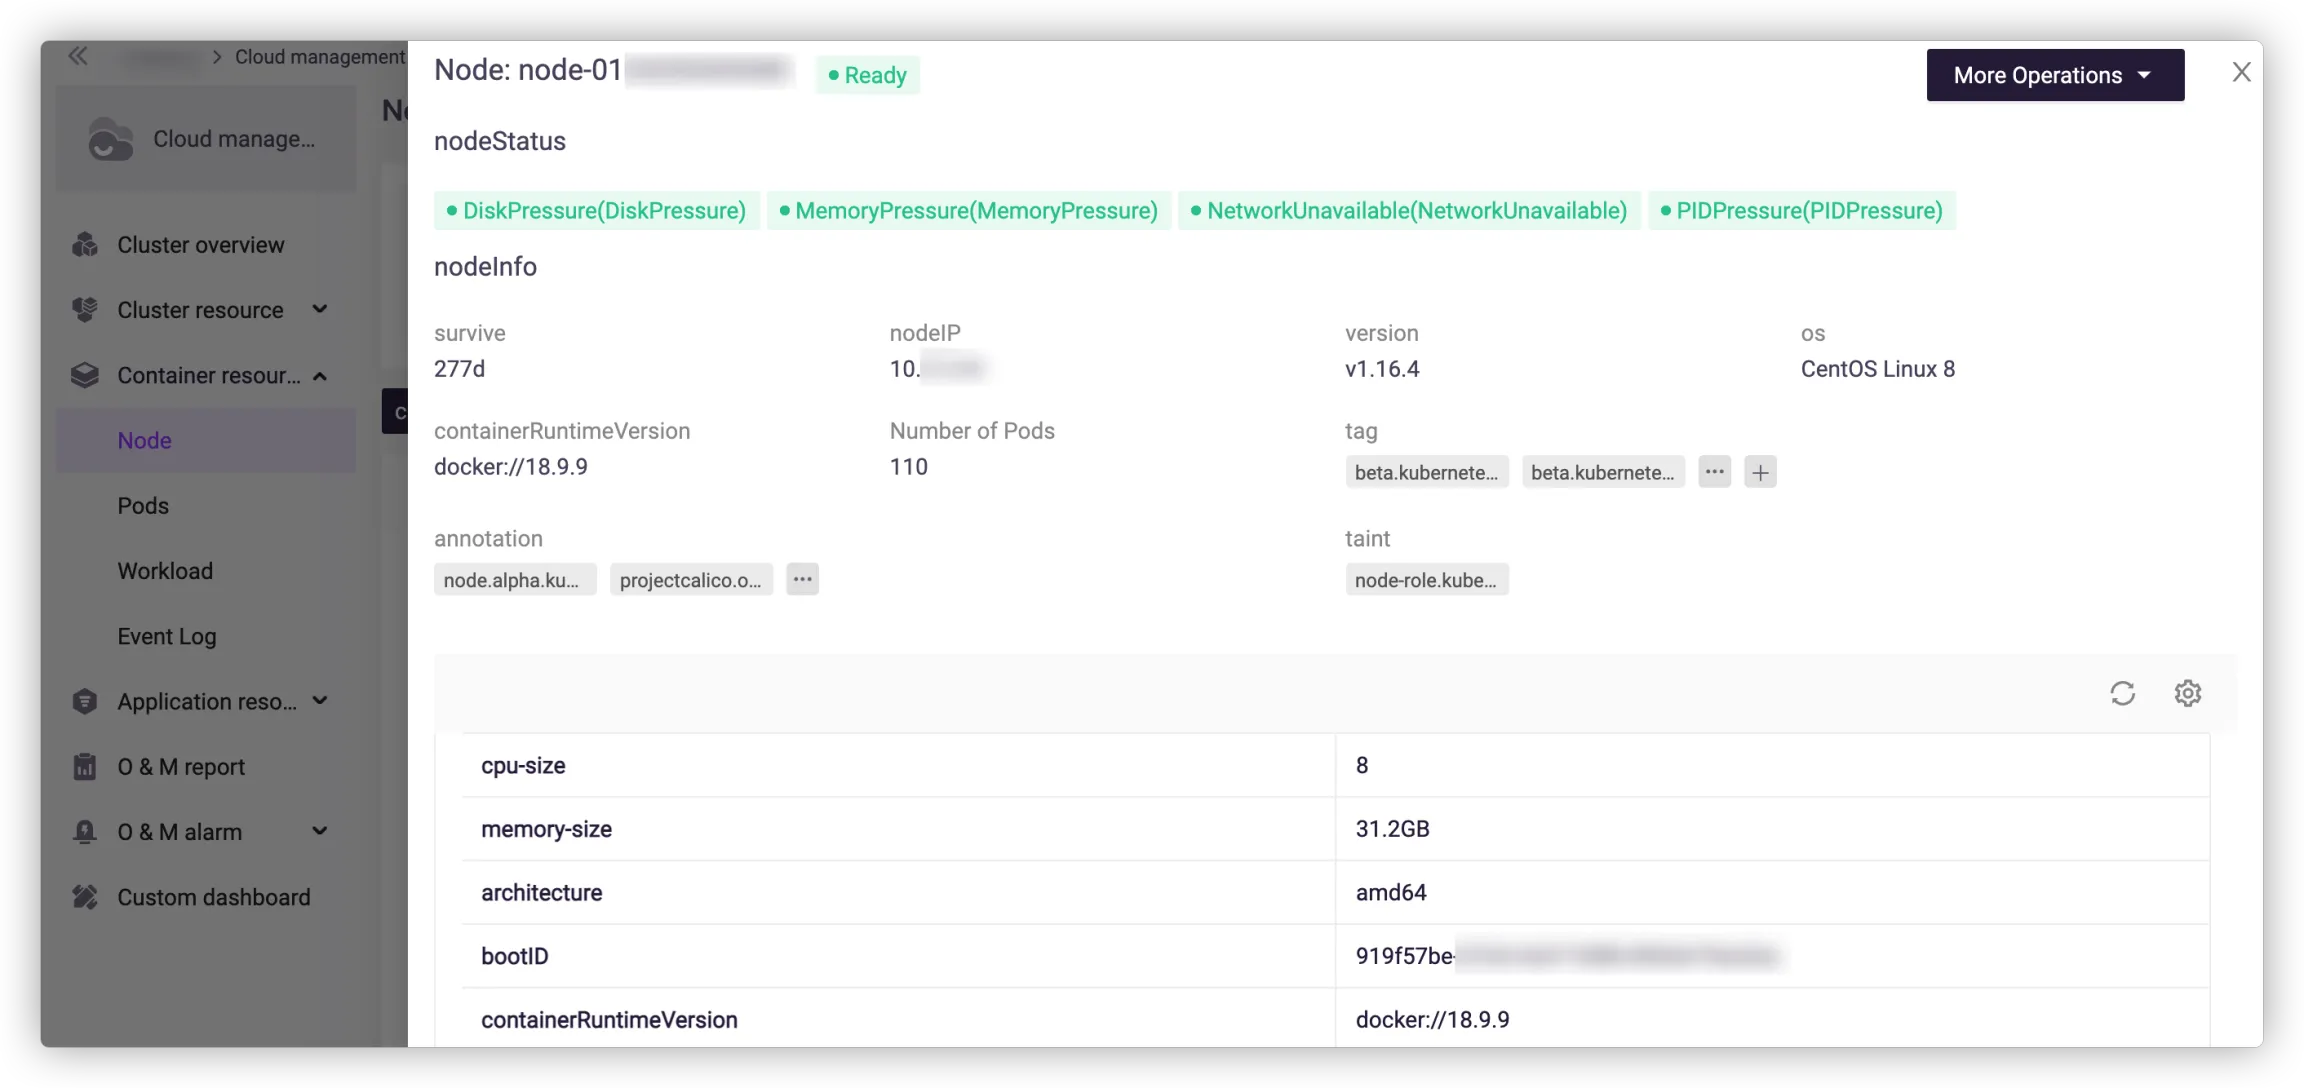
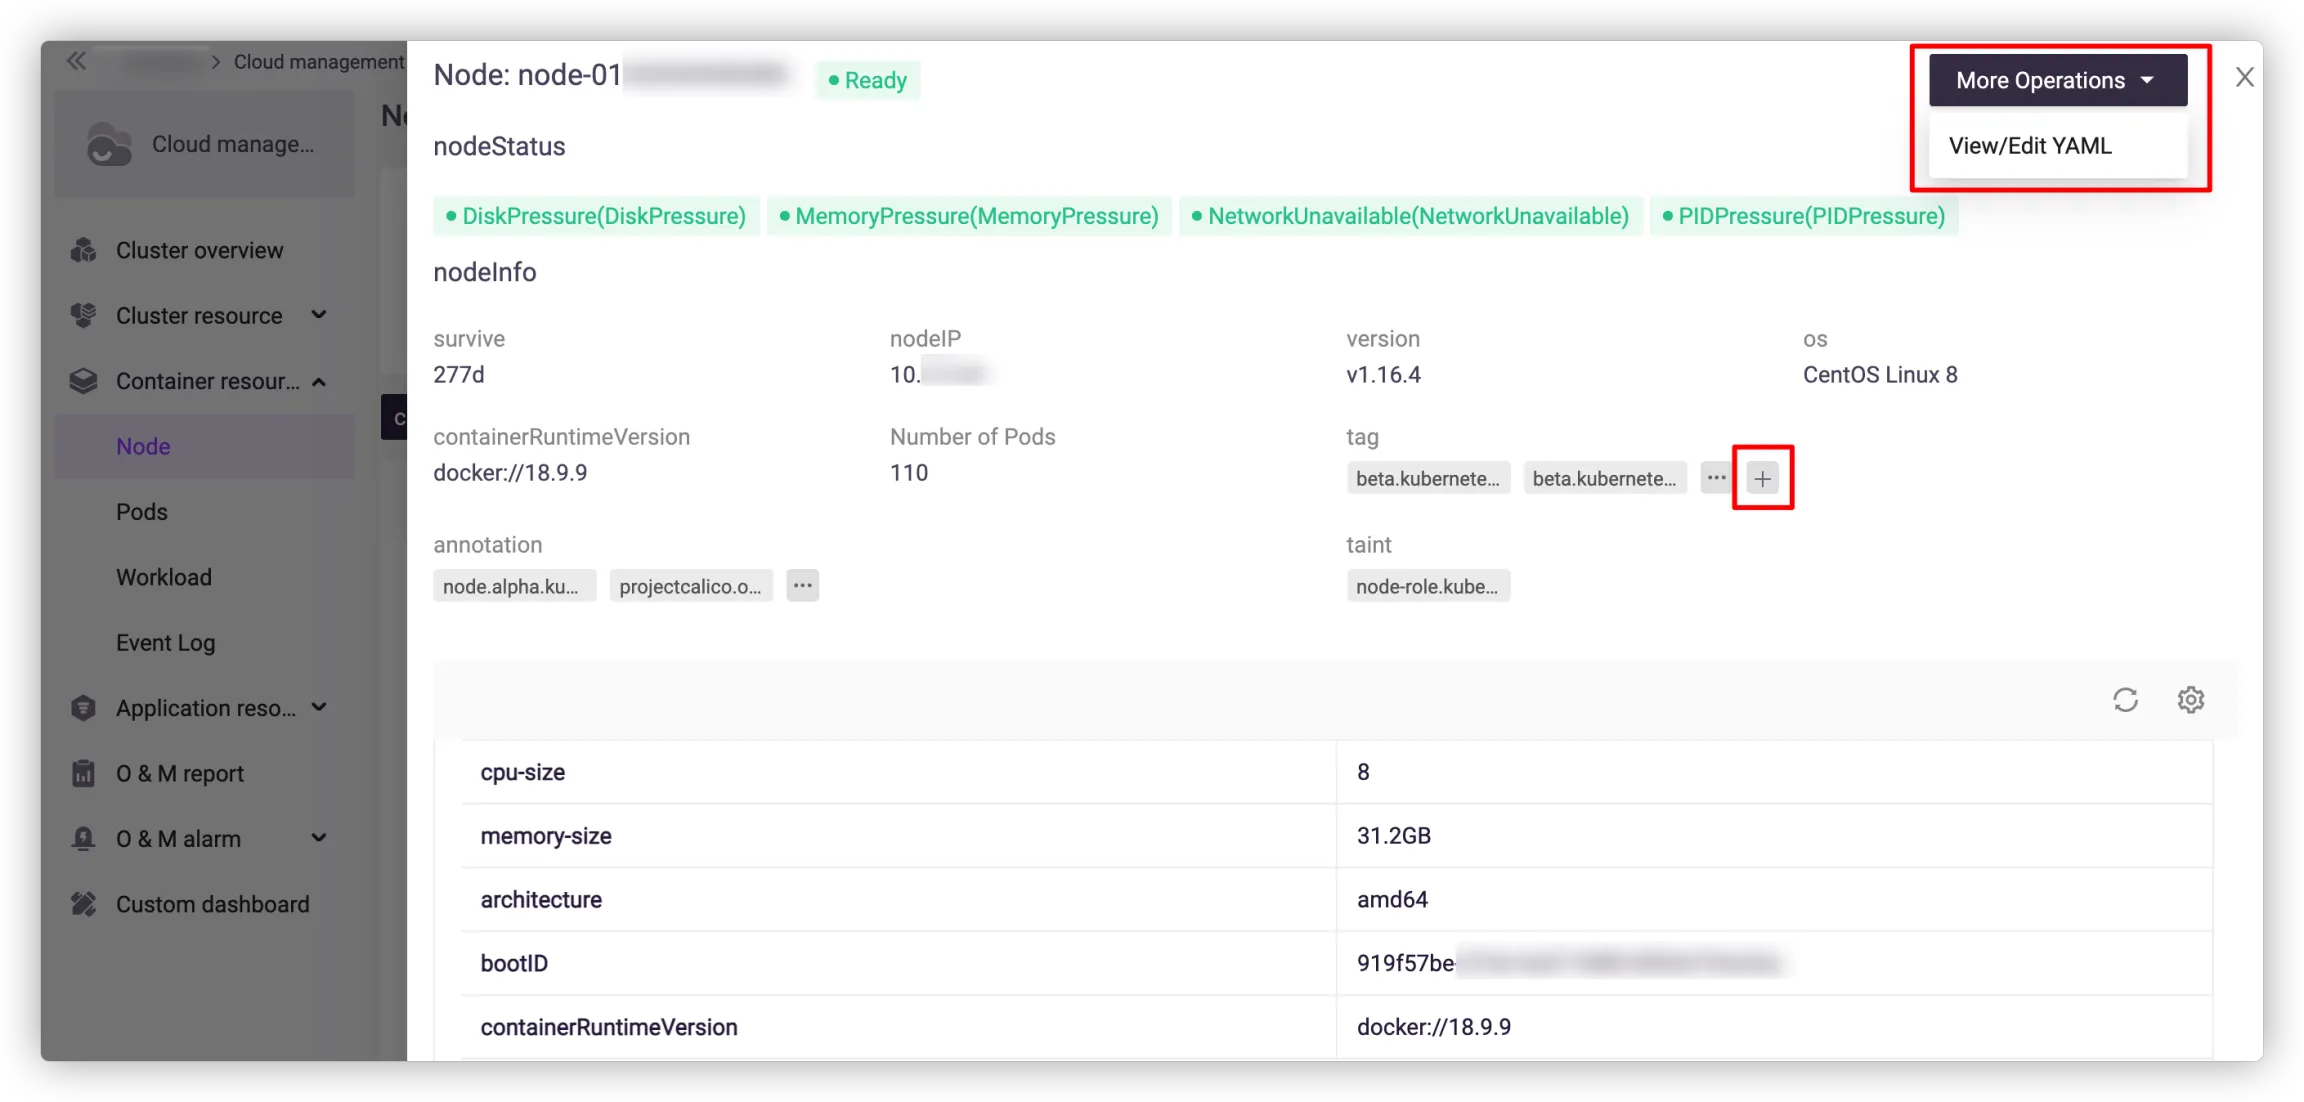
Add or delete tags as needed, or click More Operations > View/Edit YAML in the upper right corner to modify the node's YAML file.
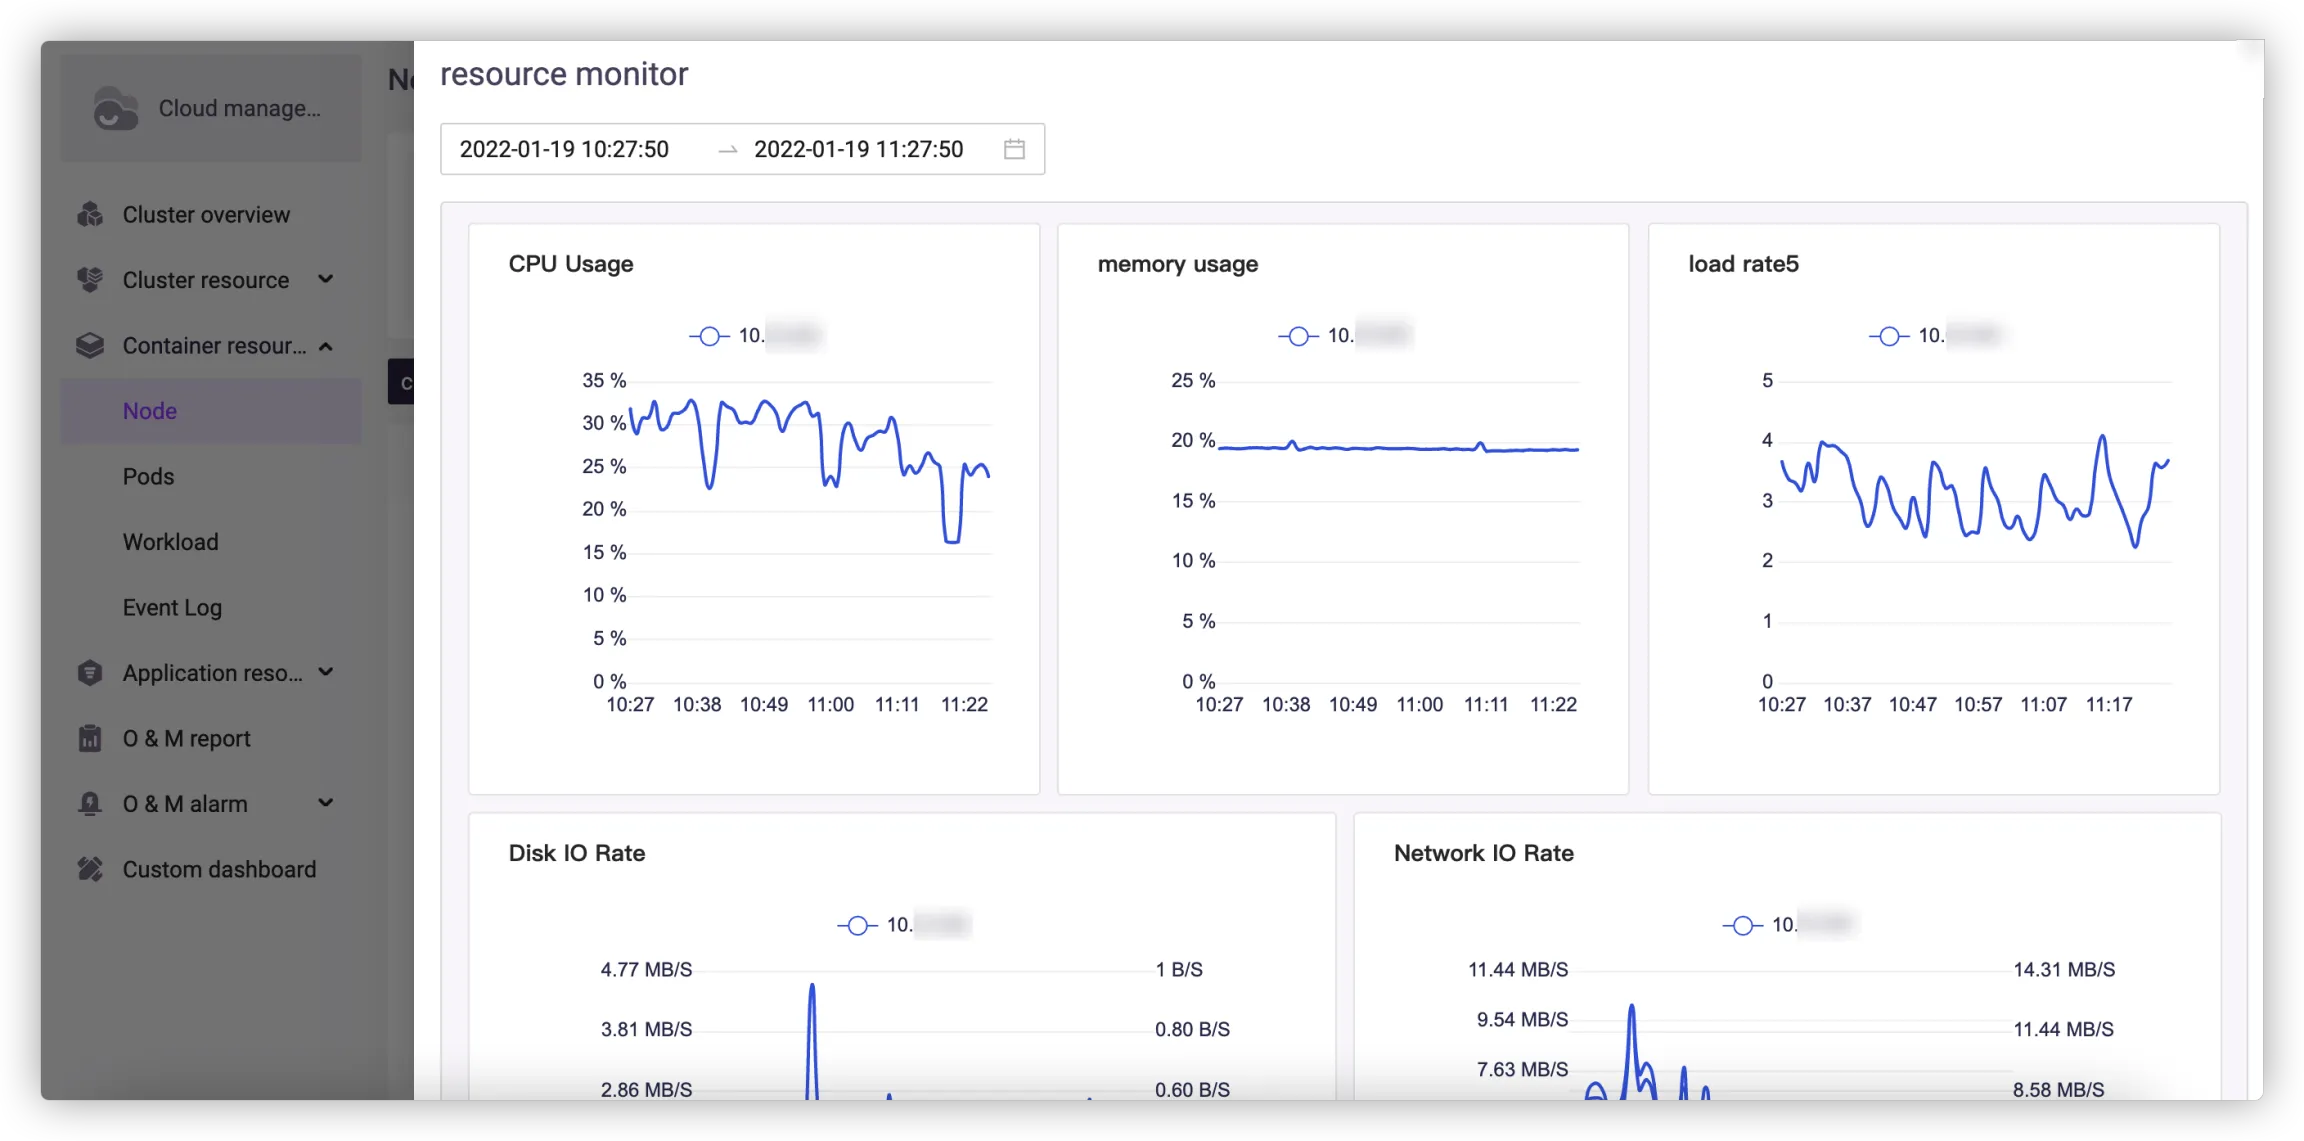
Resource monitoring is also available with information such as CPU usage, memory usage, disk IO rate and network IO rate.
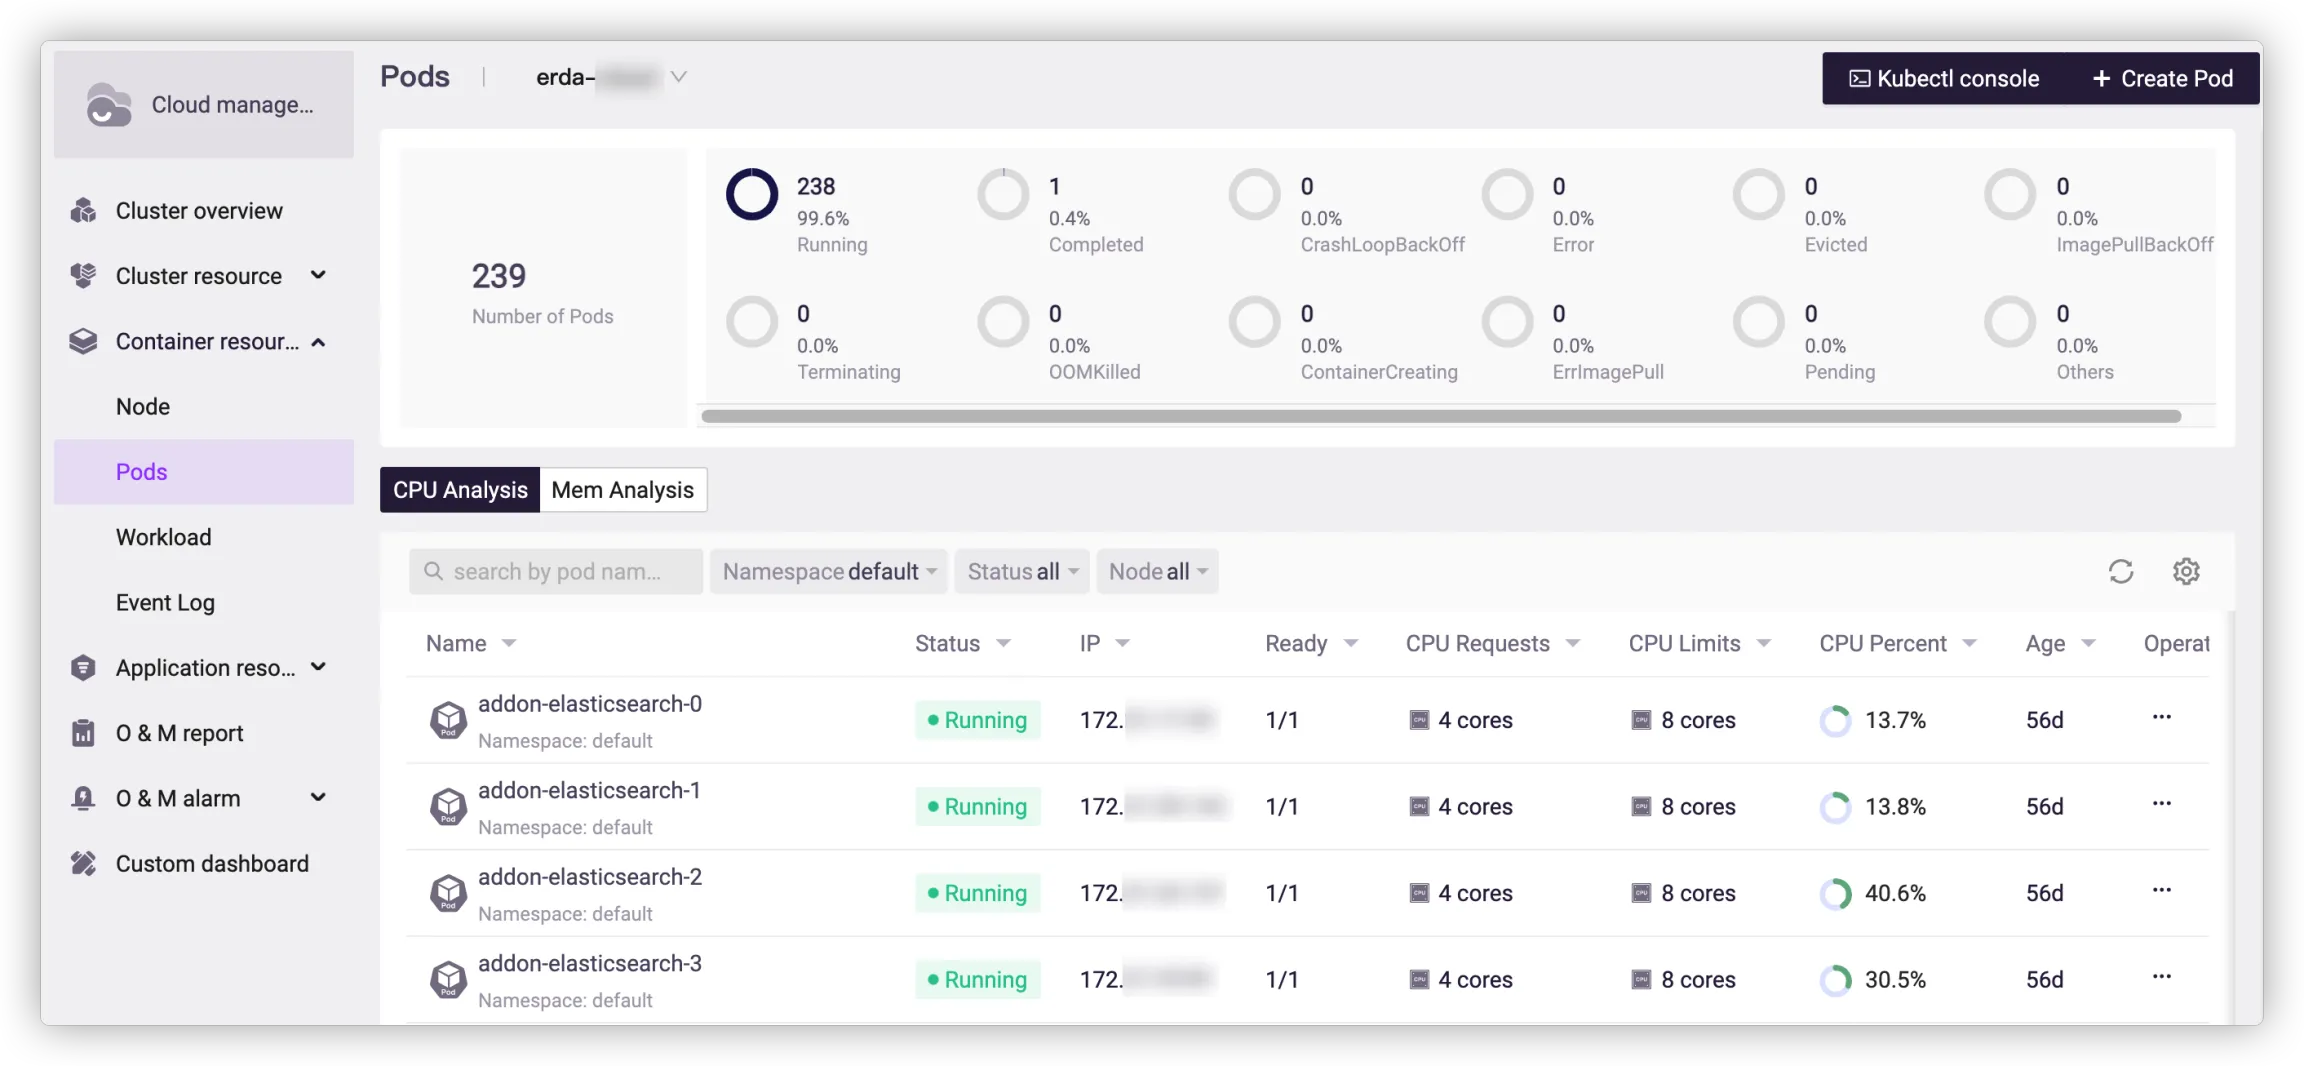
# Pod List
This page shows all pods in the cluster and you can filter them by namespace, status, node, pod name or IP. The graph of pod status tells the total number of pods in the cluster and that of each status.
In the pod list, you can view the resource request and usage of pod, including information such as pod status, name, namespace, IP, ready status, node, CPU request, CPU limit and CPU percent.
In the column of Name, you can go to the pod detail page by clicking the pod name.
# Pod Details
This page shows the basic information of the pod, including namespace, age, pod IP, workload, node, label, and annotation.
All containers in the pod are listed with operations to go to console or view logs.
All events occur in the pod are also displayed in the list.

In resource monitoring, you can view the historical operating status of the pod by indicators such as CPU usage, memory usage, disk read and write bytes, and network received and transmitted bytes.

# Workload List
This page shows all workloads of the cluster, which can be filtered by namespace, status, type and name.
You can go to the workload detail page by clicking the workload name in the list.
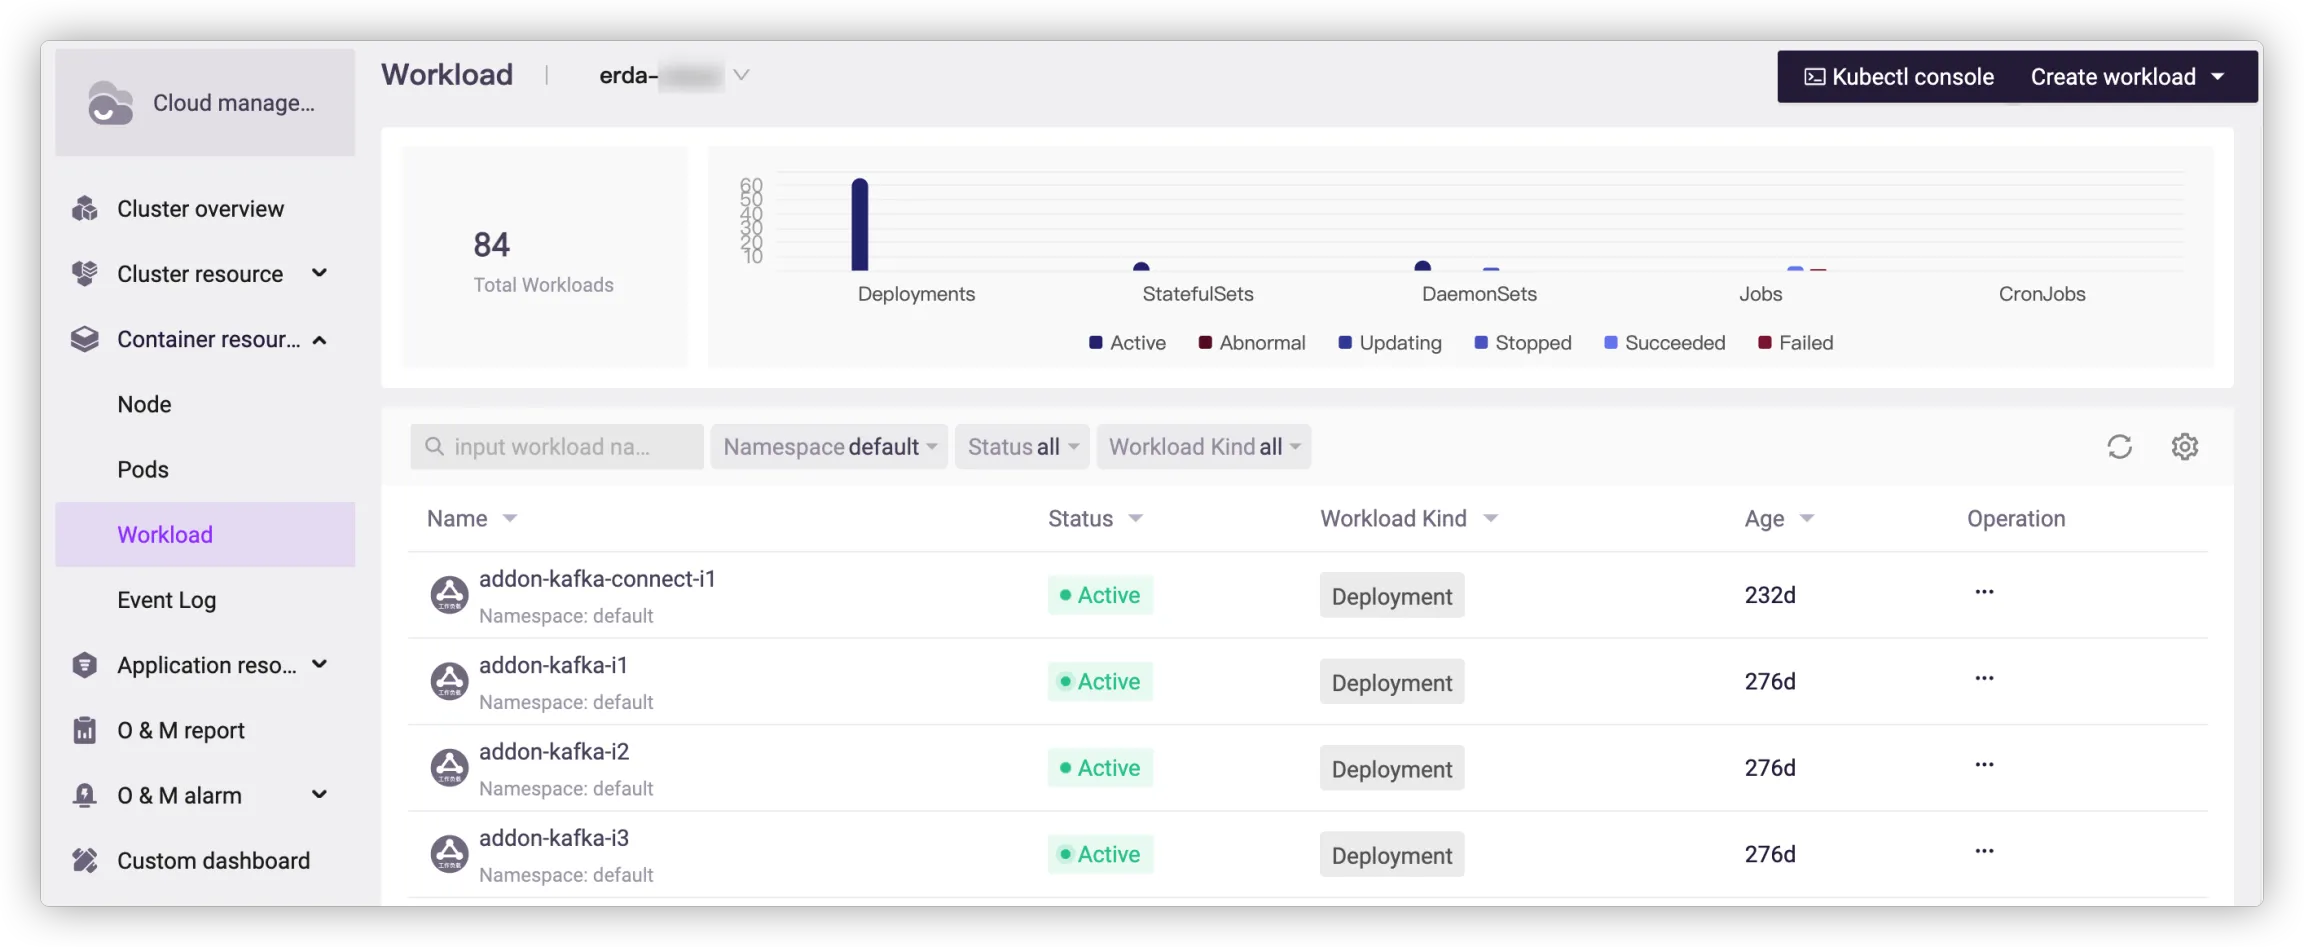
For more information on Kubernetes workloads, see Workloads (opens new window).
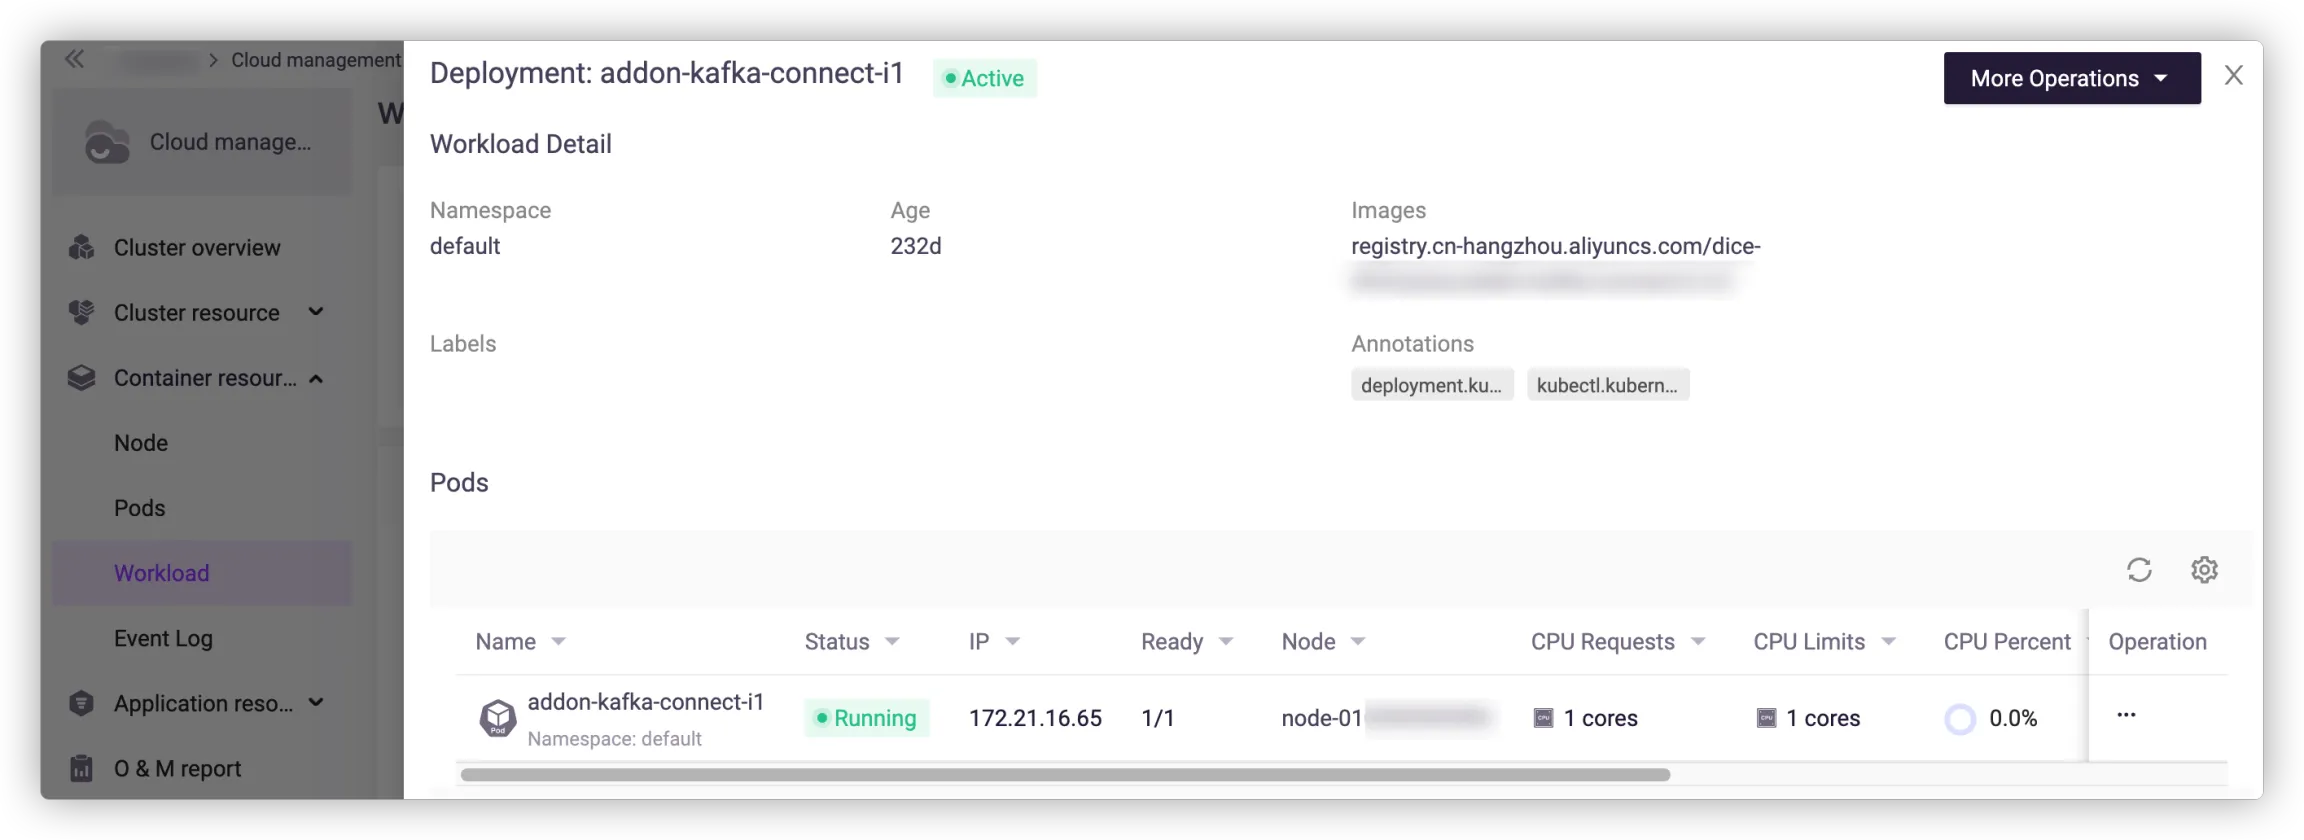
# Workload Details
This page shows the basic information of the workload such as namespace, age, image, label and annotation. You can also view the pods related to the workload for the allocation and usage.
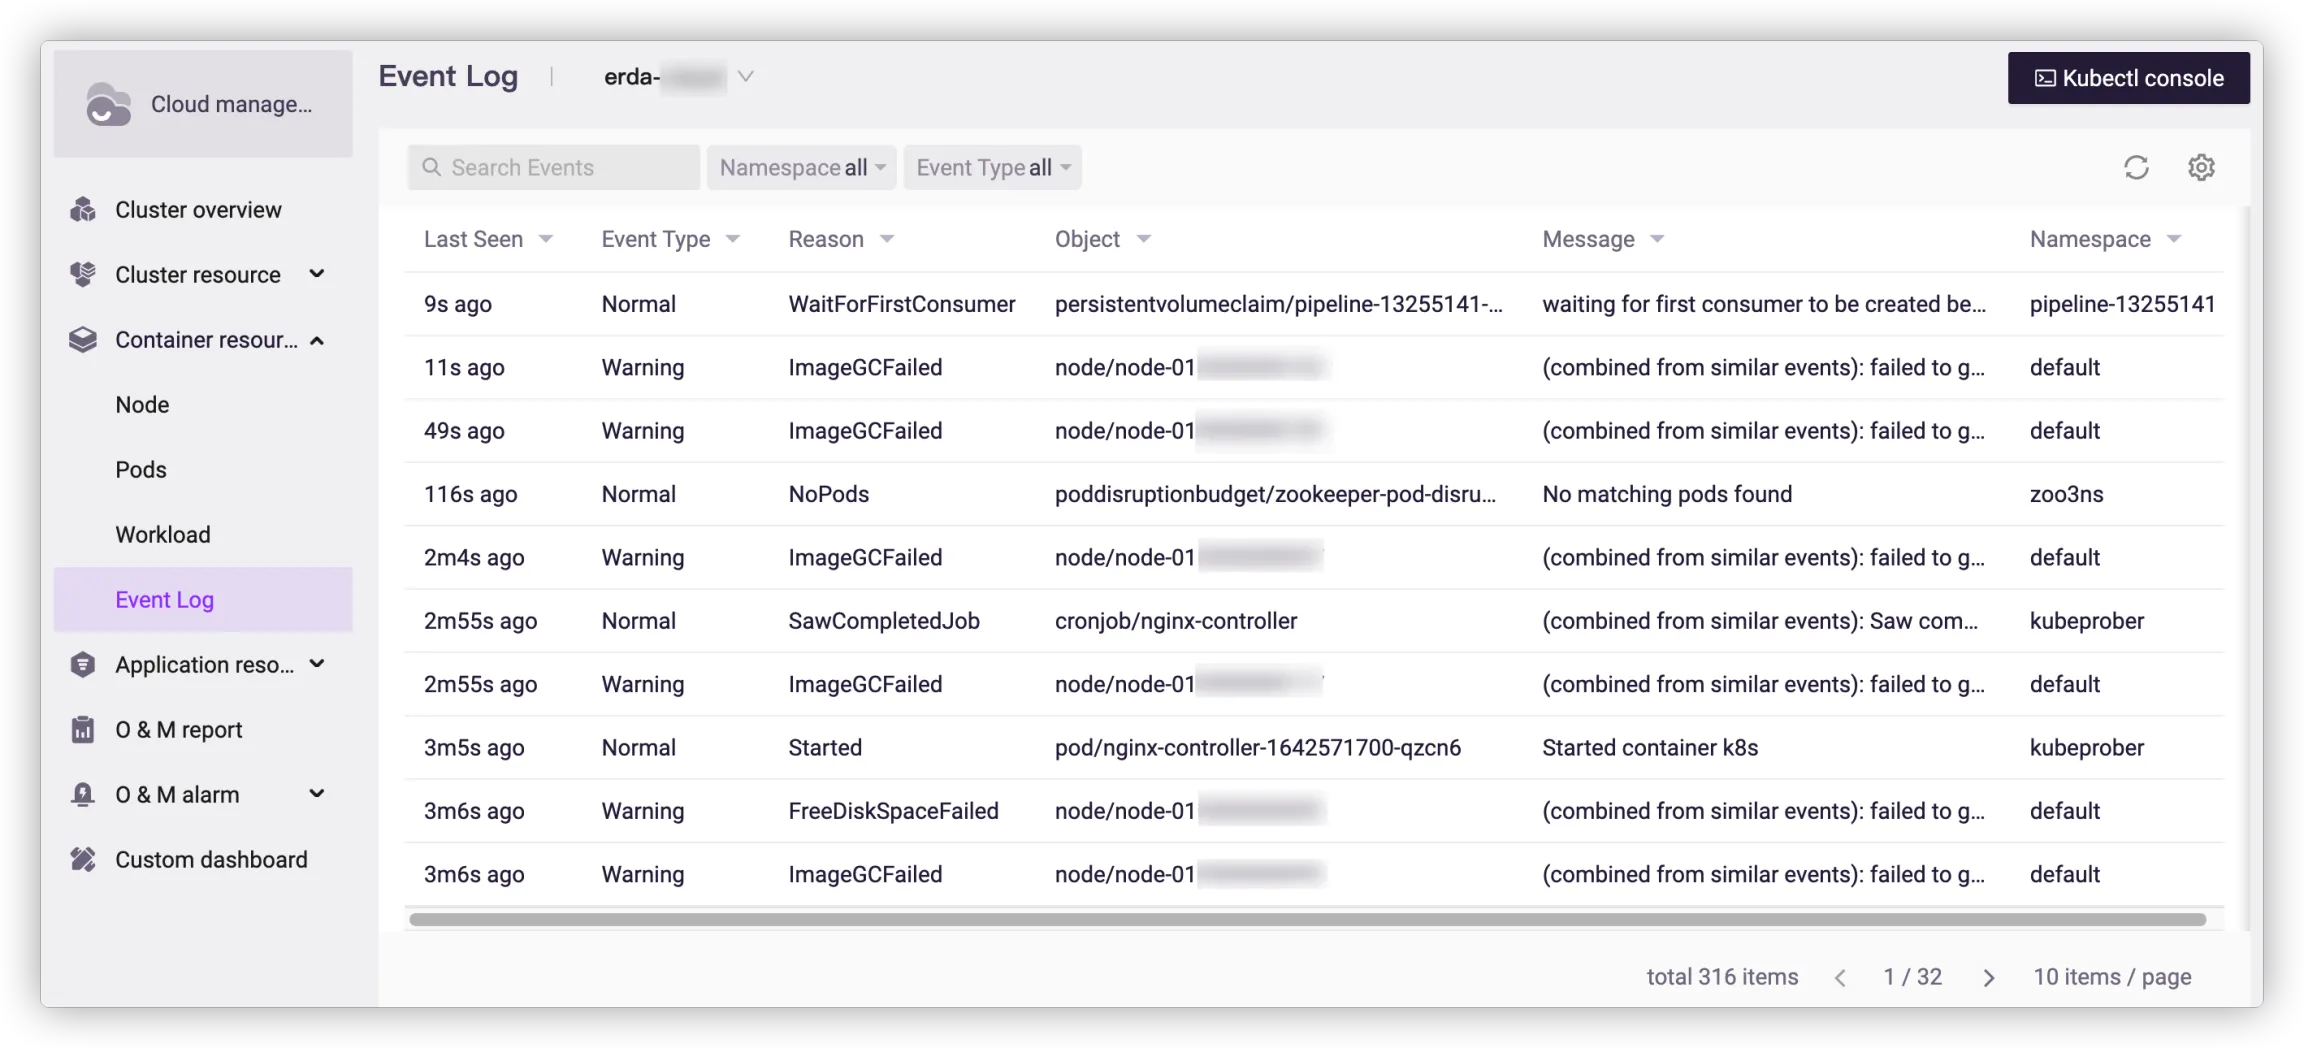
# Event Log
This page shows all events of the Kubernetes cluster within one hour, that can be filtered by namespace, type and content.